TOC
Building a Centralized Admin Dashboard for TurtleWolfe

🔧 Building a Centralized Admin Dashboard for TurtleWolfe
Running a web application means data lives everywhere. Payment records sit in one table, authentication audit logs in another, user profiles in a third, and encrypted messages in a fourth. When something goes wrong — a spike in failed logins, a payment provider returning errors, a sudden drop in user activity — you need answers fast, not a scavenger hunt across database tables.
This post walks through how we built the TurtleWolfe admin dashboard: a single, tabbed interface that surfaces metrics from four data domains while enforcing three layers of security. We built it on a statically exported Next.js 15 site deployed to GitHub Pages, which means no server-side Application Programming Interface (API) routes — every data call goes through Supabase Remote Procedure Call (RPC) functions and Row-Level Security (RLS) policies.
🗄️ Why an Admin Dashboard
Before the dashboard existed, answering basic operational questions required direct database queries. "How many payments failed this week?" meant opening the Supabase dashboard, navigating to paymentresults, and writing a filtered query. "Are any users hitting rate limits?" meant checking ratelimit_attempts with a timestamp filter. Every question required context-switching and Structured Query Language (SQL) knowledge.
The problem compounds with multiple data domains. Correlating a spike in failed logins with a drop in successful payments requires querying two separate tables and mentally joining the results. That workflow works for debugging, but it fails for monitoring.
The solution: a centralized dashboard that aggregates metrics from all four domains into stat cards, tables, and distribution views — accessible through a tabbed interface that any admin can read at a glance. No SQL required. No context-switching. One page, four domains, real-time data.
🏗️ Architecture Overview
The admin dashboard follows a three-tier pattern we ported from the SpokeToWork project. Each tier has a single responsibility:
- Page — handles authentication state, initializes services, and manages loading/error states
- Service class — wraps Supabase RPC calls and direct table queries into typed methods
- Component — receives props and renders User Interface (UI) elements with zero data-fetching logic
The Static Export Constraint
TurtleWolfe deploys to GitHub Pages as a static export. That constraint shapes every architectural decision:
- No
src/app/api/routes — API routes require a Node.js server, which static hosting does not provide - No server-side secrets — only environment variables prefixed with
NEXTPUBLICreach the browser - All server-side logic lives in Supabase — RPC functions, database triggers, and Edge Functions handle everything the client cannot
How the Page Orchestrates Services
The overview page instantiates four service classes, initializes them with the current user's ID, and fires all four getStats() calls in parallel:
// src/app/admin/page.tsx
const loadStats = useCallback(async (userId: string) => {
  const paymentService = new AdminPaymentService(supabase);
  const auditService = new AdminAuditService(supabase);
  const userService = new AdminUserService(supabase);
  const messagingService = new AdminMessagingService(supabase);

  // Initialize all services with the authenticated user's ID
  await Promise.all([
    paymentService.initialize(userId),
    auditService.initialize(userId),
    userService.initialize(userId),
    messagingService.initialize(userId),
  ]);

  // Fetch all stats in parallel for fast page load
  const [payments, auth, users, messaging] = await Promise.all([
    paymentService.getStats(),
    auditService.getStats(),
    userService.getStats(),
    messagingService.getStats(),
  ]);

  // Pass typed stats down to the presentation component
  setPaymentStats(payments);
  setAuthStats(auth);
  setUserStats(users);
  setMessagingStats(messaging);
}, []);
The AdminDashboardOverview component receives all four stat objects as props and renders them. It never calls Supabase directly. If any stat object is null (still loading), the component shows skeleton placeholders.
💳 The Four Data Domains
Each domain corresponds to a tab in the dashboard and a dedicated service class that encapsulates its queries.
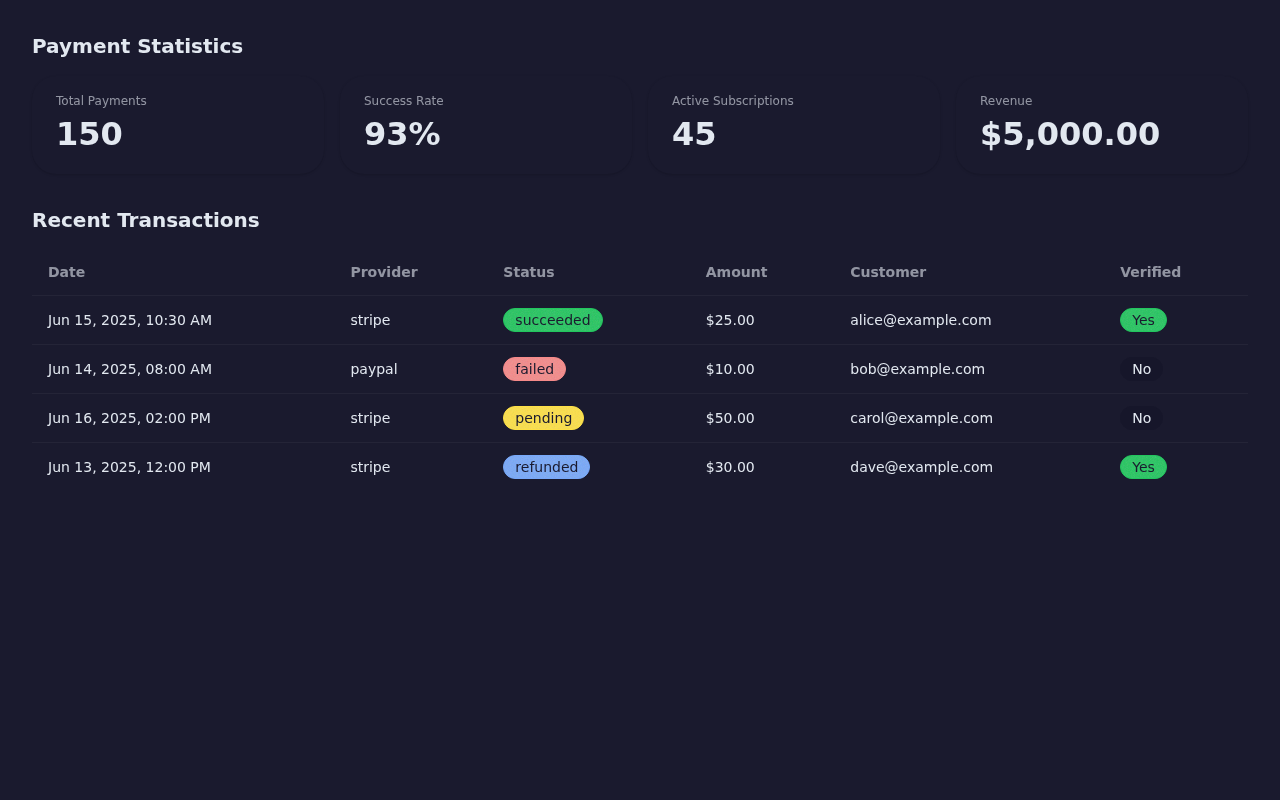
Payments: Revenue and Transaction Health
The payments domain answers three questions: How much revenue have we processed? What is the success rate? Which providers perform best?
Stat cards show total payment volume, successful/failed/pending counts, total revenue in cents, active subscriptions, and failures in the past week. Revenue by provider breaks down earnings across payment processors (Stripe, PayPal, etc.). A transaction table lists the 50 most recent payment results with provider, status, amount, currency, customer email, and webhook verification status.
The service class calls the adminpaymentstats RPC function for aggregate metrics and queries the paymentresults table directly (with a join to paymentintents for customer email) for the transaction list:
// src/services/admin/admin-payment-service.ts
async getStats(): Promise<AdminPaymentStats> {
  const { data, error } = await this.supabase.rpc('admin_payment_stats');
  if (error) throw error;
  return data as AdminPaymentStats;
}

async getRecentTransactions(limit = 50): Promise<PaymentActivity[]> {
  const { data, error } = await this.supabase
    .from('payment_results')
    .select(
      `id, provider, transaction_id, status, charged_amount,
       charged_currency, webhook_verified, created_at,
       payment_intents(customer_email)`
    )
    .order('created_at', { ascending: false })
    .limit(limit);
  if (error) throw error;
  return data;
}
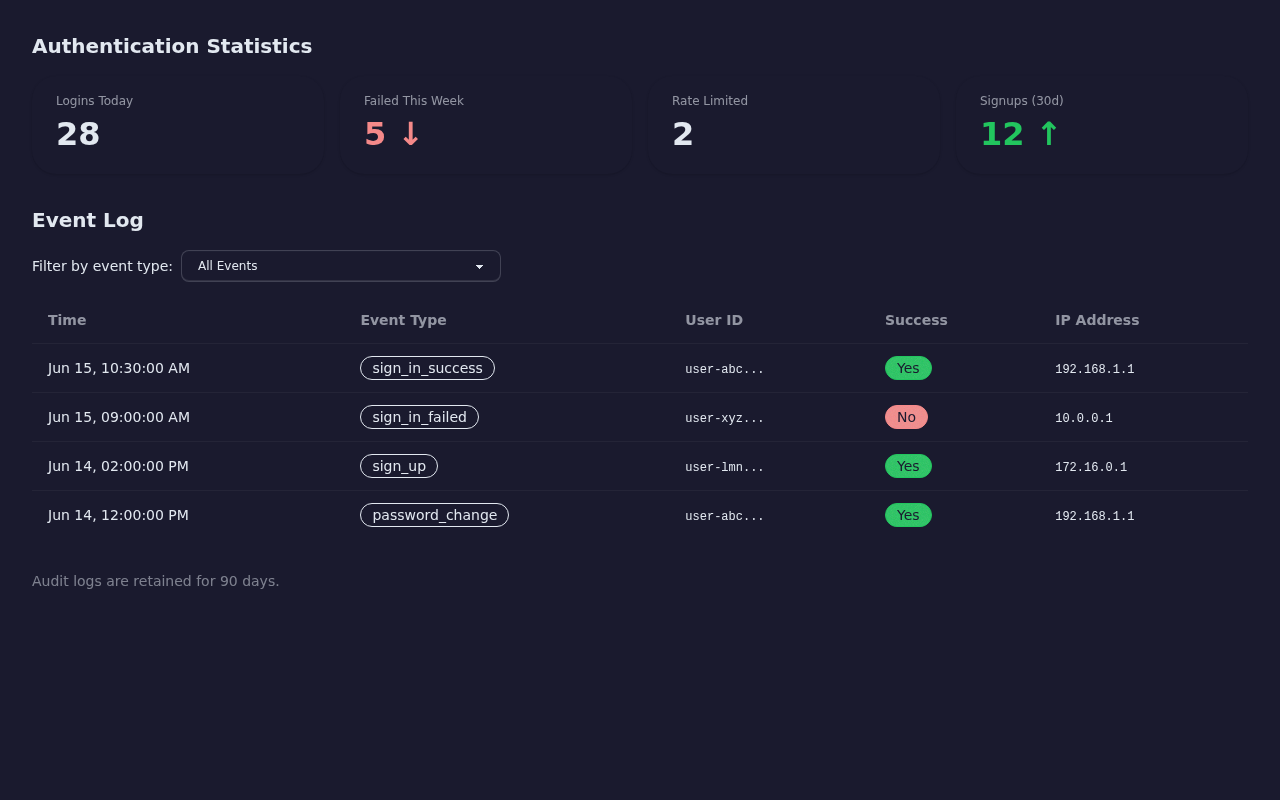
Auth Audit: Login Patterns and Security Events
The auth audit domain tracks authentication events with 90-day retention. Stat cards show logins today, failed attempts this week, sign-ups this month, and the count of currently rate-limited users. A top failed logins list highlights user IDs with the most failed attempts — useful for identifying brute-force targets.
The event log table displays individual audit entries: user ID, event type (sign-in, sign-up, password reset), success/failure, Internet Protocol (IP) address, and timestamp. An optional event-type filter narrows the view:
// src/services/admin/admin-audit-service.ts
async getRecentEvents(
  limit = 100,
  eventType?: string
): Promise<AuditLogEntry[]> {
  let query = this.supabase
    .from('auth_audit_logs')
    .select('id, user_id, event_type, success, ip_address, created_at')
    .order('created_at', { ascending: false })
    .limit(limit);

  // Optional filter by event type
  if (eventType) query = query.eq('event_type', eventType);

  const { data, error } = await query;
  if (error) throw error;
  return (data ?? []) as AuditLogEntry[];
}
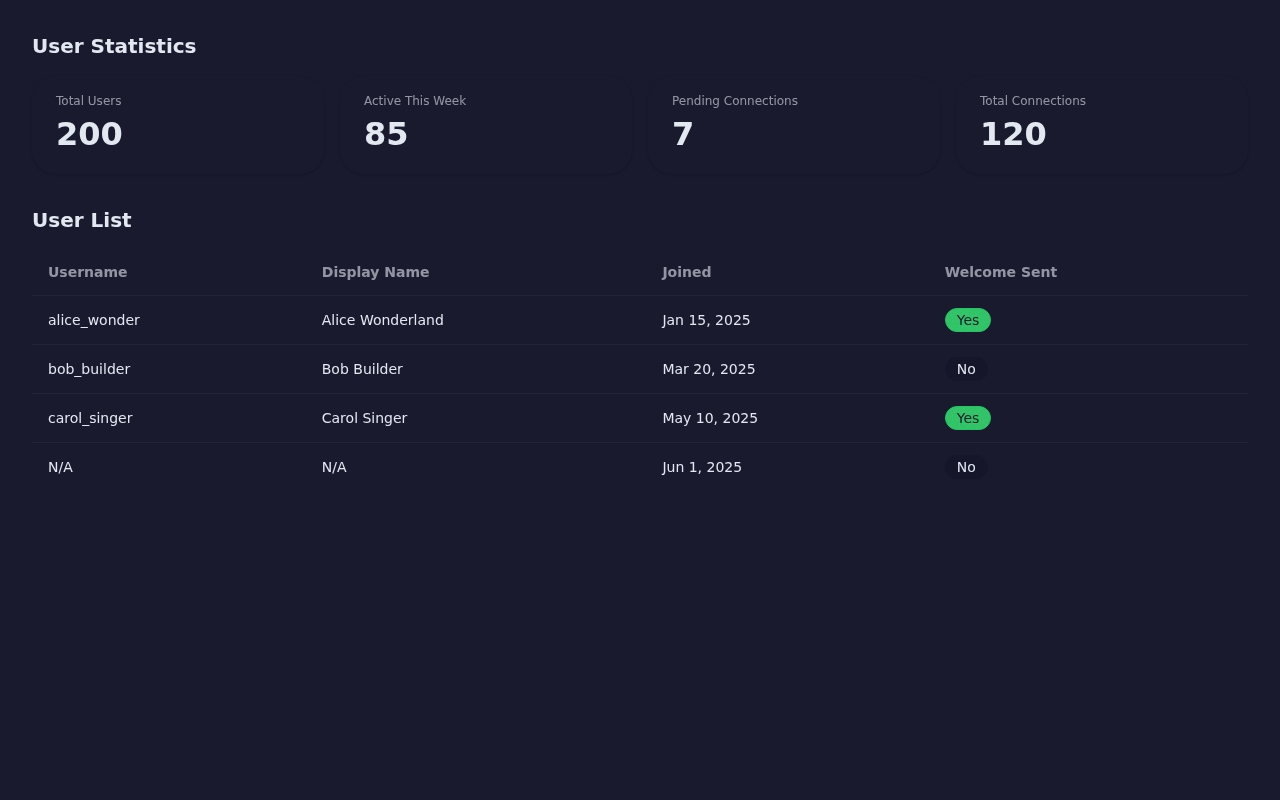
Users: Account Management and Activity
The users domain provides a high-level view of the user base. Stat cards show total users, users active in the past week, pending connection requests, and total accepted connections.
The user table lists accounts with username, display name, creation date, and welcome message status. The service filters out admin accounts (is_admin = false) so the list shows only regular users:
// src/services/admin/admin-user-service.ts
async getUsers(limit = 50): Promise<AdminUserRow[]> {
  const { data, error } = await this.supabase
    .from('user_profiles')
    .select('id, username, display_name, created_at, welcome_message_sent')
    .eq('is_admin', false) // Exclude admin accounts from the user list
    .order('created_at', { ascending: false })
    .limit(limit);
  if (error) throw error;
  return (data ?? []) as AdminUserRow[];
}
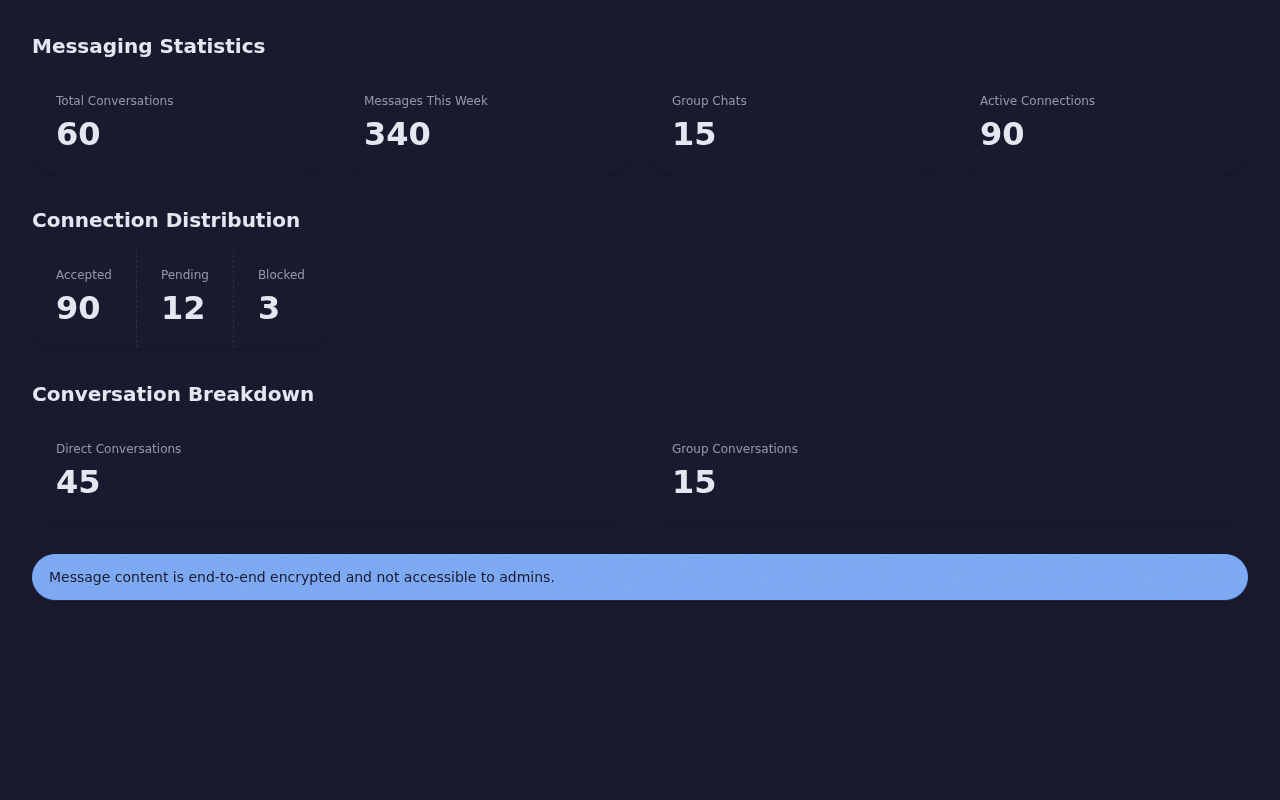
Messaging: Conversation Volume and Connection Distribution
The messaging domain surfaces aggregate communication metrics without exposing any message content. Stat cards show total conversations (split between one-to-one and group), messages sent this week, active connections, and blocked connections. A connection distribution view breaks down how many users have zero, one, two, or more connections.
The entire domain runs through a single RPC call — adminmessagingstats — because all the data comes from aggregate SQL queries that never touch the encrypted_content or iv columns on the messages table:
// src/services/admin/admin-messaging-service.ts
async getStats(): Promise<AdminMessagingStats> {
  const { data, error } = await this.supabase.rpc('admin_messaging_stats');
  if (error) throw error;
  return data as AdminMessagingStats;
}
🔒 Security: Defense in Depth
The admin dashboard enforces access control at three independent layers. Even if one layer fails, the other two prevent unauthorized data access.
Layer 1: Client-Side Admin Guard
The admin layout component (src/app/admin/layout.tsx) runs an authentication check before rendering any child page. It reads the current user from AuthContext, calls AdminAuthService.checkIsAdmin(), and redirects non-admin users to the home page:
// src/app/admin/layout.tsx
useEffect(() => {
  async function checkAdmin() {
    if (!user) return;
    const service = new AdminAuthService(supabase);
    const admin = await service.checkIsAdmin(user.id);
    setIsAdmin(admin);
    if (!admin) router.push('/'); // Non-admin users get redirected
  }
  if (!authLoading) {
    if (!user)
      router.push('/sign-in'); // Unauthenticated users go to sign-in
    else checkAdmin();
  }
}, [user, authLoading, router]);
This layer provides fast User Experience (UX) feedback — non-admin users never see the dashboard skeleton — but it offers no real security. A determined attacker could bypass client-side JavaScript. That is why the next two layers exist.
Layer 2: Row-Level Security Policies
Nine RLS policies on the PostgreSQL database enforce admin-only read access. Each policy checks the JSON Web Token (JWT) claims embedded in the user's authentication token:
-- One of 9 admin-read RLS policies
CREATE POLICY "Admin can view all payment results" ON payment_results
  FOR SELECT USING (
    COALESCE(
      (auth.jwt()->'app_metadata'->>'is_admin')::boolean,
      false
    ) = true
  );
The auth.jwt() function extracts claims from the JWT that Supabase automatically attaches to every authenticated request. The appmetadata object lives in auth.users.rawappmetadata — a field that only server-side operations can modify. A user cannot grant themselves admin access by editing their own profile.
Why JWT claims instead of a table subquery? An earlier implementation tried checking userprofiles.isadmin inside the RLS policy on user_profiles itself. This created an infinite recursion: PostgreSQL evaluated the policy, which queried the same table, which triggered the same policy, which queried the same table, endlessly. The Supabase Role-Based Access Control (RBAC) best practice stores role flags in JWT claims, which the database reads without any table query.
All nine policies follow the same pattern across these tables: userprofiles, authauditlogs, paymentintents, paymentresults, subscriptions, ratelimitattempts, userconnections, conversations, and messages.
Layer 3: RPC Functions with SECURITY INVOKER
The four admin RPC functions use SECURITY INVOKER — they execute with the permissions of the calling user, not the function creator. If a non-admin user somehow calls adminpaymentstats(), the function returns an empty JSON object ({}):
CREATE OR REPLACE FUNCTION admin_payment_stats()
RETURNS JSON
LANGUAGE plpgsql
SECURITY INVOKER  -- Runs as the calling user, respects RLS
SET search_path = public
AS $
BEGIN
  -- Non-admin users get an empty response
  IF NOT COALESCE(
    (auth.jwt()->'app_metadata'->>'is_admin')::boolean,
    false
  ) THEN
    RETURN '{}'::json;
  END IF;

  -- Admin users get the full stats
  RETURN (
    SELECT json_build_object(
      'total_payments', (SELECT count(*) FROM payment_results),
      'successful_payments', (SELECT count(*) FROM payment_results WHERE status = 'succeeded'),
      -- ... additional metrics
    )
  );
END;
$;
This creates a double gate: the RLS policy prevents the SELECT inside the function from returning rows to non-admin users, and the function itself checks JWT claims and returns empty data before even attempting the query.
End-to-End Encryption Respected
The messaging domain deserves special attention. TurtleWolfe uses End-to-End (E2E) encryption for messages — the encrypted_content and iv (initialization vector) columns on the messages table contain ciphertext that only the sender and recipient can decrypt.
The admin messaging service never queries these columns. It calls adminmessagingstats(), which runs aggregate count() queries on conversations and connections. The admin sees how many messages exist and how many conversations are active, but never the content. Even if an admin ran a raw SELECT on the messages table, they would see ciphertext they cannot decrypt — the private keys live only in each user's browser via IndexedDB.
📸 Dashboard Screenshots
The overview page renders stat cards from all four domains in a single grid:
Each tab provides domain-specific detail views with tables, filters, and distribution breakdowns.
🚀 What's Next
The current dashboard provides a solid read-only foundation. Future enhancements on the roadmap include:
- Time-series charts — Plot login volume, payment revenue, and message counts over days and weeks using a lightweight charting library. Stat cards tell you "what" but charts tell you "when."
- Real-time updates — Supabase supports Realtime subscriptions. Subscribing to
paymentresultsandauthaudit_logswould let the dashboard update without manual refresh. - Export functionality — Downloadable Comma-Separated Values (CSV) exports for the transaction table and audit log, useful for compliance audits and financial reconciliation.
- Alerting thresholds — Configurable alerts when metrics cross boundaries (e.g., failed login rate exceeds 20% in a 15-minute window), delivered through Supabase Edge Functions.
Want to explore the full implementation? Check out the TurtleWolfe GitHub repository. The admin service classes live in src/services/admin/, the page routes in src/app/admin/, and the RLS policies in supabase/migrations/20251006completemonolithic_setup.sql.
